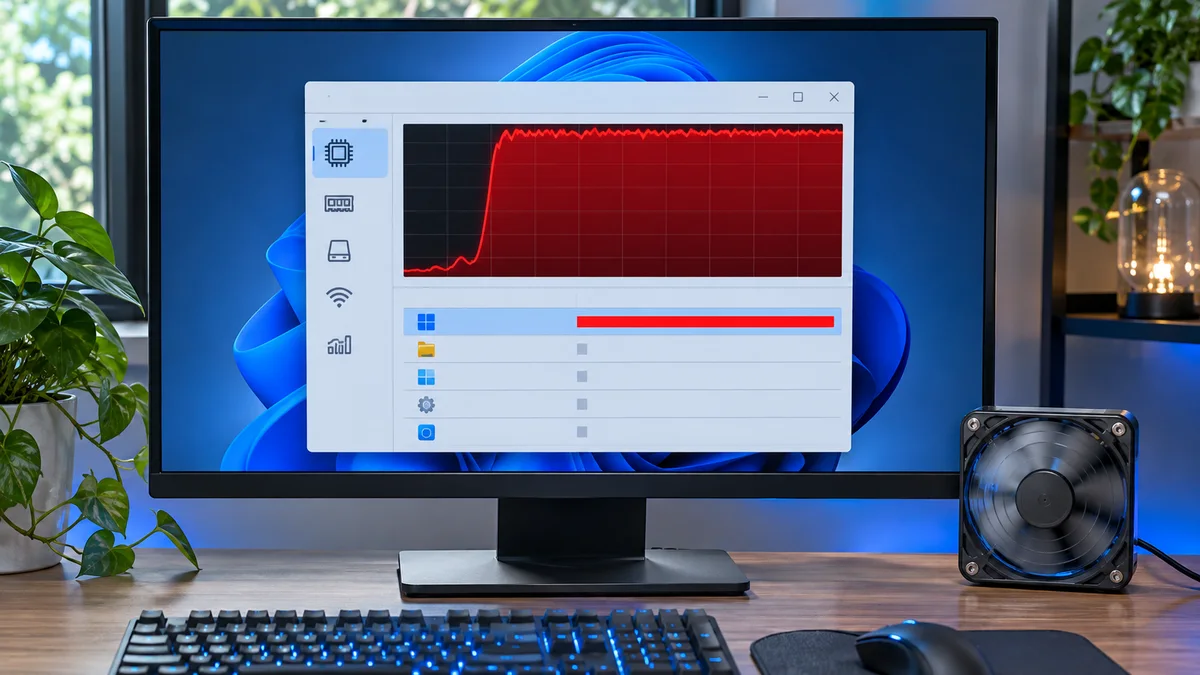
The clock on the wall in our Manhattan office read 9:40 AM. Exactly twenty minutes from now, our CEO was scheduled to stream a major quarterly update to the entire enterprise, and my primary presentation machine—a top-spec workstation—decided to throw a tantrum. The cooling fans were screaming like a jet engine preparing for takeoff, the mouse cursor was moving in sluggish, frame-dropping jerks, and Task Manager revealed a terrifying reality: the generic “System” process was locking the CPU flat at 100 percent usage. Powerpoint wouldn’t open, Teams was frozen, and the entire system was effectively paralyzed.
Panic instantly set in. For the past ten minutes, I had been blindly stumbling through typical quick fixes—frantically smashing keyboard shortcuts, force-closing random background apps, and rebooting the machine twice, only to watch the CPU peg back at maximum capacity the moment the Windows login screen loaded. Restarting was getting us nowhere, and the clock was ticking down fast.
That’s when I had to step back, put away the panic, and rely on systematic IT troubleshooting. If you are staring at a frozen screen right now with your CPU pinned at 100 percent due to a stubborn System process, take a deep breath. Here is the exact, battle-tested playbook I used to regain control in under five minutes—and how you can do it too.
Why the Windows System Process Can Use So Much CPU
In Windows, the System process hosts core operating-system work. High CPU usage can have several causes, including driver activity or background servicing; the process name alone does not identify the cause.
Possible causes include a recent driver or device change, background Windows maintenance, or another system issue. Check the symptoms and error records before choosing a fix.
A Safer Diagnostic Sequence
Let’s walk through the exact steps to diagnose and neutralize the bottleneck without losing your unsaved work.
Step 1: Isolate the Culprit Using Resource Monitor
Standard Task Manager gives you a high-level view, but we need granular data to see which thread or driver within the System process is misbehaving.
- Press
Ctrl + Shift + Escto open Task Manager. - Click on the Performance tab at the top, then click Open Resource Monitor at the very bottom.
- In the Resource Monitor window, go to the CPU tab.
- In Resource Monitor, use the CPU tab to review CPU activity and services. It does not reliably name the driver responsible for every System-process spike; do not treat
ntoskrnl.exeas a diagnosis.
Step 2: Review recent changes and errors
Check Windows Update history and Event Viewer around the time the spike began. If a device was just connected or a driver was just updated, note its name and any error code. Do not restart unrelated audio or search services as a generic fix.
Open Windows Update history and Event Viewer around the time the spike began. Note recent updates or device changes and any error codes. Do not restart unrelated services as a generic fix.
Step 3: Run DISM and SFC via Command Prompt
If corrupted system files are forcing the kernel into a loop, we need to repair the OS image immediately.
- Click the Start Menu, type
cmd, right-click Command Prompt, and select Run as administrator. - Type the following command to check the component store integrity:
DISM.exe /Online /Cleanup-image /Restorehealth - Once that completes, run the system file checker to replace damaged kernel binaries:
sfc /scannow - Reboot your system normally once the scan finishes.
Compare the First Checks
| Check | What it can tell you | What it cannot prove |
|---|---|---|
| Task Manager | Which process is using CPU | The exact driver cause |
| Resource Monitor | CPU activity and service activity | That ntoskrnl.exe is defective |
| Event Viewer | Errors recorded near the time | That every nearby event caused the spike |
Keep Changes Reversible
Do not disable or uninstall critical drivers as a trial. Network and storage drivers can affect connectivity or booting. Use the PC or device manufacturer’s instructions and make one reversible change at a time.
Frequently Asked Questions (FAQ)
Q: Can I just force-shutdown my PC by holding the power button when this happens? A: Wait for any update or save operation to finish and try a normal restart first. If the PC is fully unresponsive, use the manufacturer’s forced-shutdown instructions only as a last resort; unsaved work can be lost and an update may need recovery.
Q: Why does the System process spike right after I log in? A: Background startup and maintenance work are possibilities, but timing alone does not identify the cause. Check Task Manager, Windows Update history, and relevant error records.
Q: Does disabling SysMain (Superfetch) still help fix 100% CPU usage? A: Changing SysMain is not a general fix for high System-process CPU. Avoid disabling it without evidence and device-specific guidance; first check recent changes and recorded errors.
At a glance High System-process CPU is a symptom, not a diagnosis of a specific driver or component. Check activity and error records first; avoid disabling or removing system devices at random.